Colours
 Organisations can set company standards for mapping colours.
Individual users may customise models to their-own requirements without losing the company standards.
Organisations can set company standards for mapping colours.
Individual users may customise models to their-own requirements without losing the company standards.
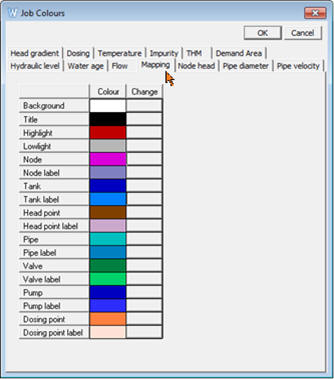
To help users visualize input data, colours can be set for:
- nodes
- pipes
- valves
- pumps
- dosing points
- labels for the above components
- demand areas, which are typically different types of land use
- pipe diameter (in colour bands)
- pipe type (in colour bands)
To help users analyse simulation results, colour bands can be set for:
- pipe velocity
- pipe flow
- pipe head gradient
- node head
- node hydraulic level
- water age
- chlorine concentration
- trihalomethane concentration
- impurity concentration
Sizes
Users can customise the size of device symbols, flow direction arrows and text.
Data Limits
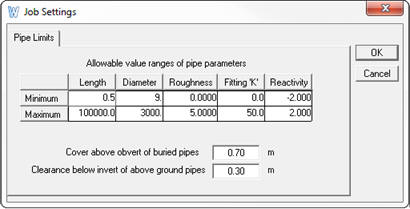 Data entries can be validated within practical upper and lower limits for:
- pipe length
- pipe diameter
- pipe roughness (or Hazen Williams coefficient)
- pipe fitting headloss coefficient
- decay constants (reactivity) used in the water quality calculations.
Standard values can be set for:
- cover above buried pipes;
- clearance below pipes laid above ground.